Showing posts with label Science. Show all posts

Friday, March 04, 2011

World's sixth mass extinction may be underway: study - Yahoo! News

Don't worry, this is not another 2012 item!  Somewhere between being the most successfully adapted species on the planet and being the wasteful, overpopulating,messy species we are, is the story of what is clearly shaping up to be the sixth mass extinction in Earth history.  Mass extinction is the term used for periods when 75 percent or more of the species on the planet go extinct, and with loss of habitat due to increasing human population, over-fishing, non-native invasive species, pollution and other human and natural processes combining to cause the extinction of hundreds of species each year, it does appear that we are in the midst of a sixth such event.

World's sixth mass extinction may be underway: study - Yahoo! News

Technorati Tags:

Monday, December 13, 2010

Sightline: Seattleites can expect to live a long time - Seattle Metro, WA Local News - Fwix

This is a wonderful article to read if you're a Seattle resident.  The amazing longevity numbers of Seattle would rank us #2 in the WORLD, just a month behind Japan, were Seattle a country.  

Sightline: Seattleites can expect to live a long time - Seattle Metro, WA Local News - Fwix

Friday, August 27, 2010

Massive solar storm to hit Earth in 2012 with 'force of 100m bombs' - Yahoo! India News

The current wave of “Mega-disaster” (after all, would people really watch tv shows and news reports if they were only reporting regular old disasters?) programs, books, articles and the now ubiquitous “internet chatter”, can now add to it this forecast for a very significant solar storm in 2012.  With space junk, magnetic pole reversal, asteroid and meteor and all the usual possible disasters that are possible, it surely seems that I might want to pull a Rip Van Winkle and snooze for the year in2012.

Massive solar storm to hit Earth in 2012 with 'force of 100m bombs' - Yahoo! India News

Technorati Tags: ,,

Tuesday, January 19, 2010

Recent Earthquakes for Yellowstone

If you recall last January I mentioned the more frequent than typical quake swarms happening then in the area around Yellowstone Lake.  It is likely nothing, but isn’t it interesting that in January of this year we see another increase above typical frequency levels.  In this swarm of 46 quakes since January 13, 2010, as you can see from the map the activity is located well to the west of the area of Yellowstone Lake and the ground rise phenomenon under the lake.  This series of small quakes are centered in the area of Buffalo Meadows quadrant on topographical maps.  

Recent Earthquakes for Yellowstone

http://www.trails.com/topo_beta.aspx?lat=44.56213&lon=-110.97427&s=100&size=s

Friday, January 01, 2010

No rise of atmospheric carbon dioxide fraction in past 160 years, new research finds

I would love to have this explained to me in accessible, non-condescending terms that my small brain can digest.  It looks like this is saying that the earth’s ability to absorb the same percentage of produced Co2 has remained unchanged over the past century and a half.  Is this a meaningful number if total Co2 produced has risen significantly?  That is, if oceans and plants are consuming 55% of the carbon dioxide produced, and have been for at least the past century and a half,  then that either means that the total amount produced is rising due to human activity and though the percentage absorbed is constant, the rising volume means rising total levels.  Is this then going to produce anomalies in the models used to predict climate change – anomalies tending toward overstating warming?  Looking forward to your comments!

No rise of atmospheric carbon dioxide fraction in past 160 years, new research finds

Wednesday, December 02, 2009

Daniel Henninger: Climategate: Science Is Dying - WSJ.com

Interesting commentary by Daniel Henninger in the WSJ.  The shabby aspects of ‘climategate’ seem to deal more in attempts to block dissidents from publication and tricking numbers to manipulate them into being ‘right’ – that is, to reflect what the scientist in question assumed they would.   The shoddy behavior of a few scientists does not change the facts.  Whether the planet is warming, and whether the cause is human activity or not is not changed by a small group of ‘scholars’ attempting to trick the numbers or keep others who disagree from publishing.  Henninger refers to Gallileo, and it doesn’t seem that much of a stretch to see global warming driven by human activity as an article of faith which must be served if one wishes to prosper in scientific endeavors.  Scientists are called to a higher discourse and regard for free exchange of information and ideas.  Though it does not change whether the earth is warming due to our activities or not, the behavior of our scientific community does bear on not only this question but the whole of scientific discourse.  IMO.

Daniel Henninger: Climategate: Science Is Dying - WSJ.com

Thursday, November 19, 2009

Stagnating Temperatures: Irony puts a Silly Hat on Yet Another Global Climate Change Summit

Okay, so if I haven’t bored you with my lame metaphysical theory before, lucky you.  But not that lucky, as I will do it now.  After observing the world, the way it works, the way we interact; in fact the sum total of my education and experience from birth to the moment of epiphany went into this theory:  At the root, at the smallest possible level, we will someday learn that the universe and all of its’ components are built of this basic material.  What is it?  Irony.  Yes, irony.  Look closely enough at almost any situation and one finds irony of varying degrees.  For example, let’s say you were going to have a global summit to face the crisis of global warming.  You were going to invite Prince Charles to repeat his prediction of immanent disaster if we don’t reduce greenhouse gases dramatically this year.  Let’s say you are planning to press national governments to enact and enforce emissions standards projected to cost hundreds of billions of dollars at a time when the global economy is teetering on the brink of a huge depression.  What would be ironic, in this situation?  I think the subject of the following article does the trick nicely in showing us the irony of which we are all assembled.  According to this Spiegel article (and many other reports in news sources, journals and science magazines as well), the earth has stopped warming.  Just in time to make the people who have been predicting catastrophe look a bit silly and alarmist.  Whether you attribute this phenomena of stagnated temperatures to ocean current patterns, or the historic low levels of sunspot activity since 2000, you must admit that I may be right.  Irony might be the cause of the whole thing.

Stagnating Temperatures: Climatologists Baffled by Global Warming Time-Out - SPIEGEL ONLINE - News - International

Tuesday, November 03, 2009

Mapping Knee Pain Helpful in Diagnosing and Treating Osteoarthritis

From National Institute of Arthritis and Musculoskeletal and Skin Diseases Spotlight on Research, September 2009

Although it is well understood that osteoarthritis causes progressive damage and pain to the knee joint, currently doctors do not have good data concerning which types of damage or location leads to various experiences of pain by patients.  According to C. Kent Kwoh, MD, "Right now we don't have a good idea of what causes knee pain, and different people have various types of knee pain. The Knee Pain Map gives us a better way of describing different groups of people in terms of their knee pain and then getting a better understanding of what's causing it and ultimately how to cure it or help people manage it better."

Dr. Kwoh recently conducted a study to evaluate the impact a standardized process using a diagram of the knee allowing the interviewer to map the locations a patient indicates to be the focus of pain.  The study included nearly 800 patients, and allowed interviewers to determine if pain in the knee was localized to any of seven areas in the knee, or regionalized to any of four larger (hand sized) areas of the knee, or if the patient was either unable to locate the pain in an area the size of their hand, or if the patient was unable to locate the knee pain it is termed to be diffuse.

The researchers found that participants with knee pain could identify pain locations and patterns and that trained examiners could reliably record the location of knee pain using the Knee Pain Map. "To our knowledge, this is the first study that allowed patients to either point to an area or cover a region that hurt, giving the patient the responsibility of identifying their pain as being in a specific location versus a more general region," Dr. Kwoh and his colleagues wrote in the journal Arthritis & Rheumatism.

“It is likely that there are several different causes and sources of pain, says Dr. Kwoh. While there are no nerve endings in the cartilage itself, the surrounding structures - including bone, joint lining, ligaments, etc. - do have nerve endings that may be sources of painful sensation, he says. Mapping the location of pain may eventually help doctors better understand the causes or sources of pain and how to treat them.

The next step will be to compare findings from patients' reports on the Knee Pain Map with x-ray and MRI findings collected as part of the Osteoarthritis Initiative (OAI), a public-private partnership between the NIH and private industry that seeks to improve diagnosis and monitoring of the progression of OA and foster development of new treatments. Nearly 5,000 people who have OA or are at risk of OA are participating in the OAI at four centers in the United States. In addition to x-ray and MRI scans, participants provide biological specimens (blood, urine, and DNA) and clinical data such as dietary intake, medication use and pain, function, and general health assessments.”

Mapping Knee Pain Is a Reliable Way to Identify Pain Location and Pattern

Tuesday, June 30, 2009

Echoes of Past Complaints

One of the many issues over which the Bush Administration was criticized heavily (and probably rightly so) for was suppressing information and opinions in the EPA whish disagreed with the administration’s policy.  That’s okay in many management settings, but I hate to see it when what is being curtailed is not merely points of view in conflict with chosen policy, but scientific discussion and debate.  In the case of the Bush Administration it seems clear that data which did  not support the administration's skepticism of global warming and human-based causes of warming.  Now it seems that the Obama Administration is doing the same thing, albeit the data being suppressed is in conflict with the administration’s view that earth is warming and human activity is driving it.  At the EPA, a 38 year veteran researcher concluded that the earth is probably not warming and may actually be cooling.  He also wrote that it is probably not necessary to regulate carbon dioxide emissions at this point.  He actually sees signs that earth is cooling recently and may be back to mid-20th century levels.  You can read more about the censoring of his report and the details of its’ content here:  http://news.cnet.com/8301-13578_3-10274412-38.html

If it is bad for one administration to suppress research that opposes its’ policies, it is bad for all administrations to do so.  Far better to consider and reply to such research than just to try and quash it – which seldom works anyway.

Wednesday, April 29, 2009

WHO Raises Pandemic Flu Alert Level to Phase 5

“GENEVA (AP) — The World Health Organization has raised its pandemic alert for swine flu to the second highest level, meaning that it believes a global outbreak of the disease is imminent.”

THIS IS A BREAKING NEWS UPDATE”

Associated Press Breaking News

Monday, January 26, 2009

Quantum Teleportation Over 3 Feet

According to an article in Science Daily, a team from the Joint Quantum Institute (JQI) at the University of Maryland (UMD) and the University of Michigan has succeeded in teleporting a quantum state directly from one atom to another over a meter apart.

http://www.sciencedaily.com/releases/2009/01/090122141137.htm

Sunday, January 04, 2009

Colder Weather Spurs Late Revival of Arctic Ice

Arctic Research Center:  Sea Ice Ends Year at Same Level as 1979
9972_large_daily_gsia


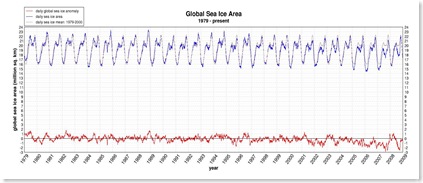
  "Thirty years of sea ice data. The record begins at 1979, the year satellite observations began (Source: Arctic Research Center, University of Illinois)

Thanks to a rapid rebound in recent months, global sea ice levels now equal those seen 29 years ago, when the year 1979 also drew to a close. "        

--Michael Asher (Blog) - January 1, 2009  Link to full entry


Arctic sea ice decreased significantly through much of last year, but satellite data shows the trend was reversed late in the year, with the rate of increase from September to year end showing the fastest rate of change on record - either for rate of increase or rate of decrease.  According to the University of Illinois's Arctic Climate Research Center as reported in the Dailytech.com blog above, the information is collected via satellite observation of the Northern and Southern hemisphere polar regions.  This is the method used to calculate snow cover data as well.

Sea ice is a very useful indicator of short-term trends because it forms and melts much more quickly than the huge and thick ice sheets anchored to bedrock in Antarctica and around the Arctic Circle.  In the last quarter of 2008, the thinner sea ice had less snow cover than the ice sheets to insulate it from the bitterly cold air, and therefore grew much faster than expected, according to the National Snow and Ice Data Center.

The Arctic Research Center report (Arctic Research Center Website) uses a system based upon the mean ice anomaly - a measurement which reflects the difference between the current sea ice value and the mean sea ice value for the period between 1979 and 2000 (1979 is the year satellite data first began to be used for this purpose).  The above image shows the mean sea ice anomaly value at near 1, about where it was in 1979.  Note that as late as September the word "unprecedented" was frequently being attached to predictions of low sea ice levels:

http://geology.com/news/2008/arctic-sea-ice-levels.shtml

arctic-sea-ice-in-death-spiral-second-lowest-on-record

http://news.cnet.com/8301-17912_3-10043977-72.html

This is just one of the many ways that science continues to learn about the processes, causes and effects, and the historical record for climate related processes on earth.  Because the record is so complex, it can be very difficult to model the future based on data from multiple and variable sources, collected by different means and over a very short period of time, in terms of the planetary history.  Clearly, science does not yet understand all of the earth's processes or the complex interrelationships that drive them. 

By way of disclaimer, though, please note that merely publishing reports that do not conform to global warming doctrine at face value does not in any way indicate that I am a denier.  I am uncomfortable with many definitive statements that are made concerning earth processes for which we have only cursory and recent data to interpret.  However, that does not mean that we should conduct ourselves as if our activities have no impact on the planet.  Clearly they do, and to whatever extent science ultimately demonstrates, human actions are wasteful and have an unnecessary impact on the ecosystems and processes of the planet.  I prefer to take a logic-based approach in this case rather than an empirical approach where facts are tough to demonstrate.  The logic-based approach, as I see it (and no doubt Gifford Pinchot would concur), is simply to conserve our natural resources, minimize the footprint of humans to the greatest practical degree, and to conduct our future designs, economy and collective lifestyle with as great an emphasis on preserving the natural processes and resources of the earth as we can manage.  By taking this approach, the objective of the current global warming proponents can be met without the need of introducing political agenda and public relations into the scientific process.  The need to prove that each wasteful or polluting activity is having grave consequences right now is moot, if the guiding principal is conservation. 

Oh, and yes, I realize that is idealistic.  Once we have uniformly adopted conservation I propose we move on to world peace. 

Wednesday, December 31, 2008

Yellowstone Earthquake Swarm Update

Others

Illustration of a Yellowstone eruption from the Discovery Channel/BBC co-production 'Supervolcano'.

The small earthquakes are continuing today in the caldera at Yellowstone National Park, with a couple of mid-sized events near and above 3:

Recent Quake List 

Yellowstone Quake Map

It is clear that no one is sure what, if any larger significance these events will have, in terms of a volcanic or hydrothermal event, but geophysicists and geologists are keeping close watch.  FEMA has announced that it is monitoring the events.  Why?  Well, it is possible that the tremors are a precursor to an eruption, though the odds are low, as such events occur only every 600,000 years, or so.  Still, it has been approximately 640,000 years since the last supervolcano eruption at Yellowstone, and even events that happen only rarely all happen at a precise moment in time. 

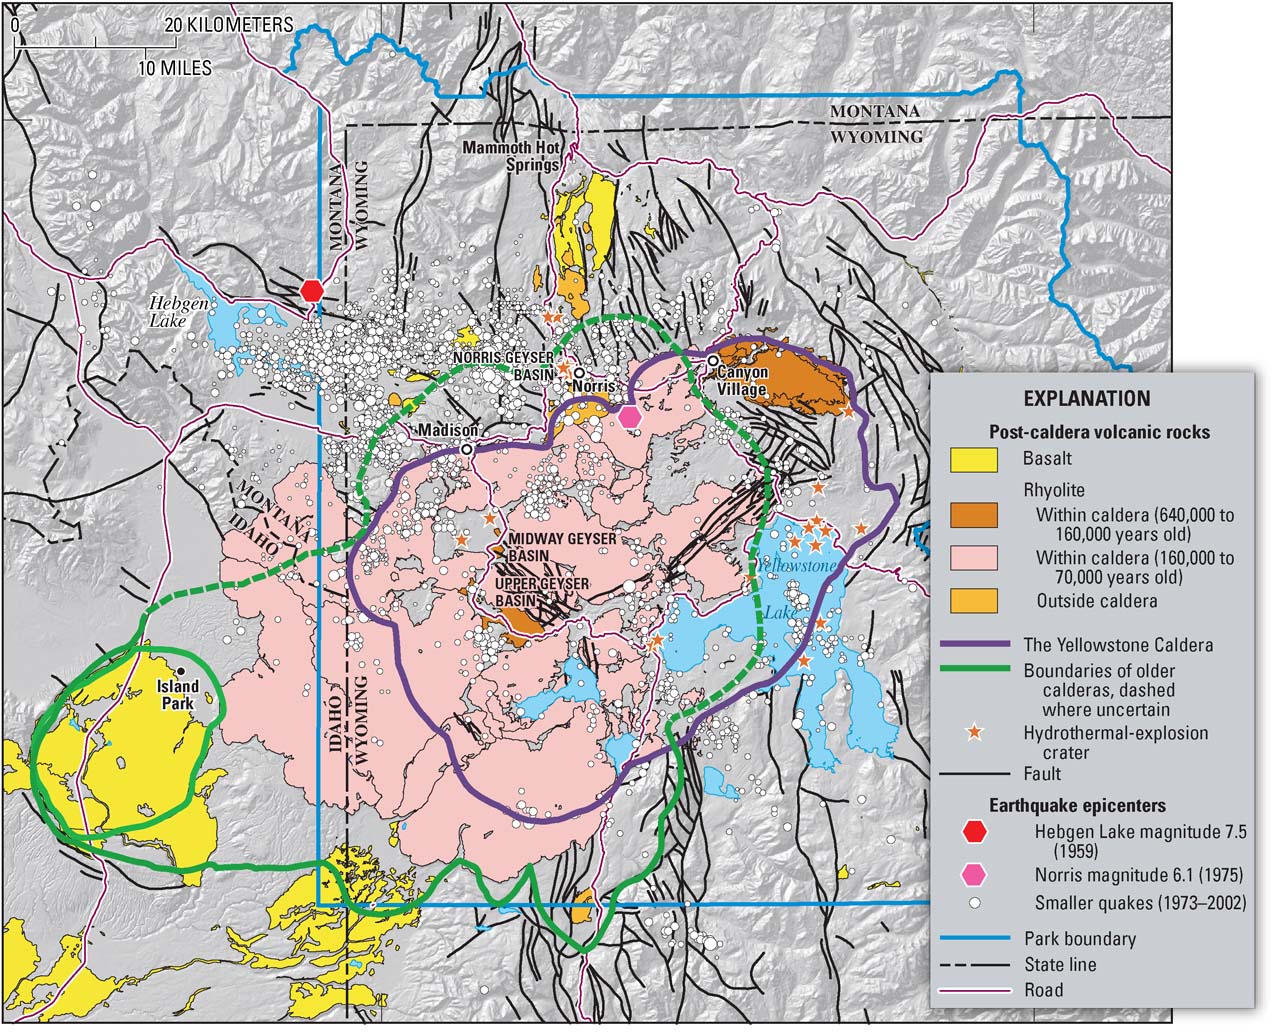
Another possibility, and one more likely, it appears, is for a hydrothermal explosion.  This occurs much more frequently and can vary widely in size.  A hydrothermal explosion occurs when superheated water finds it's way to the surface and the reduced pressure creates an explosive release.  There are ten of these craters at Yellowstone, and they vary widely in size.  Debris can be thrown hundreds of feet to tens of miles in such explosions.  It is interesting to note that the cluster of small quakes now underway in Yellowstone are all in an area at the Northern end of Yellowstone Lake, the same area where most of the hydrothermal explosions in the Park have occurred over time (look for the stars in this map):

Yellowstone Volcanic Events Map

Streaming video of Old Faithful: Old Faithful Webcam Streaming Live

So, just what kind of event is about to happen, if any?  Most people's gut reaction is probably right - that is, to have a passing thought about cataclysm, think twice about going for a snowmobile run around Yellowstone Lake, and go on with a regular day.  Without 'showing your work' as math teachers like to say, this thought process reflects complex math and risk assessment.  That is, it gives weight to each of the several possibilities approximately according to their likely occurrence. 

The story has begun to get press- after four days - worldwide, but still the only comments from Dr. Smith for the record are from Monday morning, and tell us that this is unusual and we don't know what it may indicate.

If you're interested in the seismograph images for the area: University of Utah Seismograph Webcorders

If you're interested in a visual interpretation of the quake swarm check out:  Yellowstone Earthquake Swarm December 2008

If you'd like to investigate the dome-building activity go here: Yellowstone ground deformation data

Additional links:

Volcanic Locations near Yellowstone Lake

US News Article with discussion of supervolcano intensity scale

Google Blog Search for Yellowstone Quake Swarm

Google News Search

Geologic History of Yellowstone and Direction of North American Plate Movement

Tuesday, December 30, 2008

Yellowstone Earthquake Swarm

Over the past several days, something that may just be very unusual has been occurring in ancient caldera in Yellowstone National Park.  Over 250 micro earthquakes have occurred during that brief time, and while earthquake swarms are not uncommon in themselves, either at Yellowstone or other volcanoes, several aspects of this current swarm make it unusual, and therefore very interesting.

First, the many small earthquakes are not only occurring rapidly, but they are occurring in a very small area, less than one kilometer across.  They are also happening in Yellowstone lake just below, and immediately around the location of a dome on the floor of the lake - discovered only recently. 

Second, the quakes are generally very shallow.  Several have been less than .3 kilometers from the surface, and the average depth is about 2.5 kilometers, which places them at about the same depth as the magma chamber that drives the geothermal engine at Yellowstone, fueling the geysers.

Third, the quakes are occurring within the caldera itself, while the smaller swarms of 1985, 1995 and 2004 all occurred outside the caldera, nearer to Hebgen lake.  It is very likely that the quakes are related to magma movement through the geophysical system at Yellowstone, but it seems to be unclear to scientists at this time whether the quakes are a precursor to some sort of eruption, or just a particularly active set of routine quakes.  said Robert Smith, a professor of geophysics at the University of Utah said that "they're certainly not normal", and added that "we might be seeing something precursory. "

In the past couple of years seismologists have inched closer to developing a predictive technique to allow warnings before eruptions.  This technique was used to prevent loss of life in the eruption of Popocatepetl in 2000.  It indicates that sometimes harmonic tremors and quake swarms can predict volcanic eruptions. 

Likely the swarms at Yellowstone are just a larger than usual magma movement event, and no eruption is imminent.  At least, we'd best hope so, because the world's largest supervolcano would almost certainly cause immeasurable destruction both in the area within 100 miles and indeed around the world.  Some links to follow the action:

http://earthquake.usgs.gov/eqcenter/recenteqsus/

http://www.seis.utah.edu/

http://www.quake.utah.edu/helicorder/heli/yellowstone/index.html

http://www.quake.utah.edu/recenteqs/Maps/111-45.html

http://quake.utah.edu/req2webdir/recenteqs/Maps/Yellowstone_full.html

Map showing earthquakes


Saturday, November 08, 2008

Scientific American: The Secret to Raising Smart Kids

Hint: Don't tell your kids that they are (smart). More than three decades of research shows that a focus on effort—not on intelligence or ability—is key to success in school and in life.

http://www.sciam.com/article.cfm?id=the-secret-to-raising-smart-kids

Thursday, October 30, 2008

MIT scientists baffled by global warming theory, contradicts scientific data

from Trendwatch

By Rick C. Hodgin

Thursday, October 30, 2008 09:55

Boston (MA) - Scientists at MIT have recorded a nearly simultaneous world-wide increase in methane levels. This is the first increase in ten years, and what baffles science is that this data contradicts theories stating man is the primary source of increase for this greenhouse gas. It takes about one full year for gases generated in the highly industrial northern hemisphere to cycle through and reach the southern hemisphere. However, since all worldwide levels rose simultaneously throughout the same year, it is now believed this may be part of a natural cycle in mother nature - and not the direct result of man's contributions.
Methane - powerful greenhouse gas
The two lead authors of a paper published in this week's Geophysical Review Letters, Matthew Rigby and Ronald Prinn, the TEPCO Professor of Atmospheric Chemistry in MIT's Department of Earth, Atmospheric and Planetary Science, state that as a result of the increase, several million tons of new methane is present in the atmosphere.
Methane accounts for roughly one-fifth of greenhouse gases in the atmosphere, though its effect is 25x greater than that of carbon dioxide. Its impact on global warming comes from the reflection of the sun's light back to the Earth (like a greenhouse). Methane is typically broken down in the atmosphere by the free radical hydroxyl (OH), a naturally occuring process. This atmospheric cleanser has been shown to adjust itself up and down periodically, and is believed to account for the lack of increases in methane levels in Earth's atmosphere over the past ten years despite notable simultaneous increases by man.  Continue reading article here

Sunshine on Discovery Bay

Sunshine on Discovery Bay
As always, the photos we use are either my own, or in the public domain. Please let me know if there are any errors and I'll correct them immediately.